Mia Schmidt · 20 October 2026
Charting User Retention Patterns Following Feature Rollouts in Auction-Driven Marketplaces
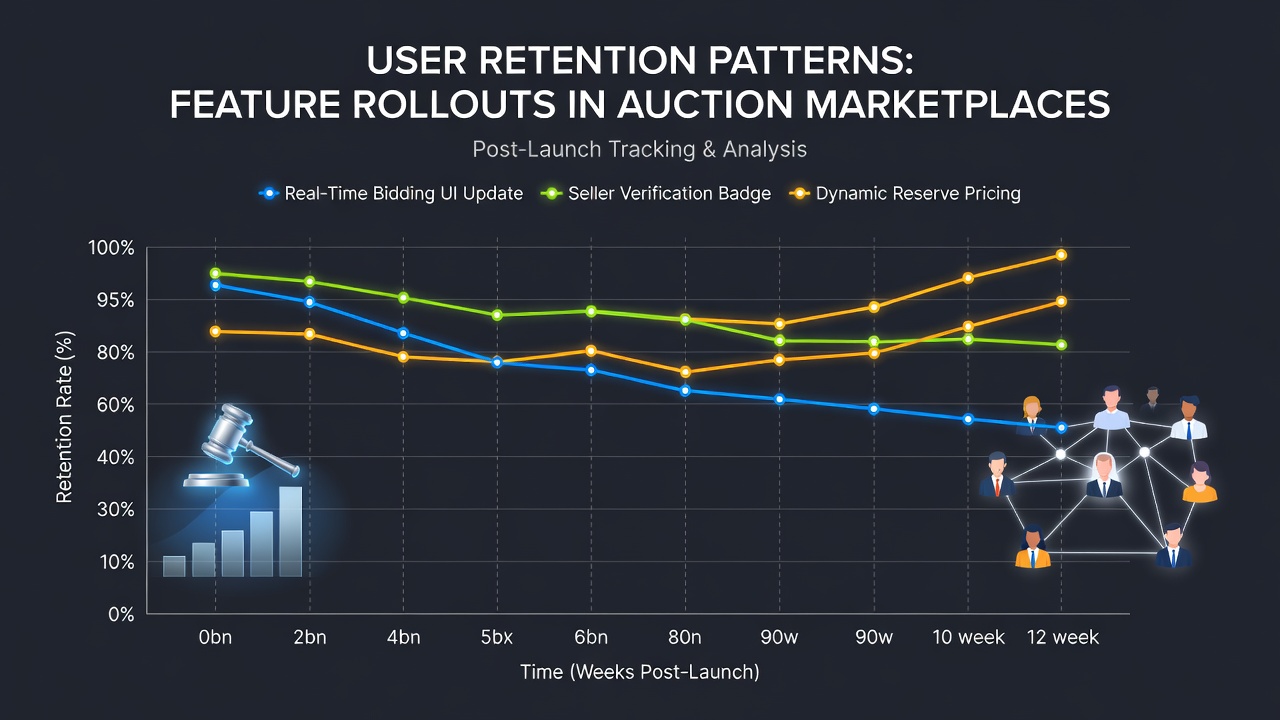
Marketplaces built around auctions track how buyers and sellers stay active after new tools appear, and data from multiple platforms shows distinct retention curves tied directly to rollout timing. Researchers collect daily active user counts, session lengths, and repeat bid rates before and after each launch to map the shifts. In October 2026 several major sites released bidding-assist features that altered these patterns in measurable ways, with retention metrics rising sharply in the first 14 days then settling into longer plateaus.
Data Collection Methods in Auction Environments
Teams pull retention figures from server logs that record each account's last bid, last listing, and last login date, then segment users by tenure and category. Cohort analysis groups participants who joined in the same week so changes after a feature release stand out against baseline trends. External benchmarks come from sources such as the Federal Trade Commission reports on digital commerce and OECD studies on online marketplaces, which supply aggregate statistics for comparison across regions. These datasets allow analysts to isolate the effect of a single rollout from seasonal spikes in holiday bidding.
Typical Retention Curves After Rollouts
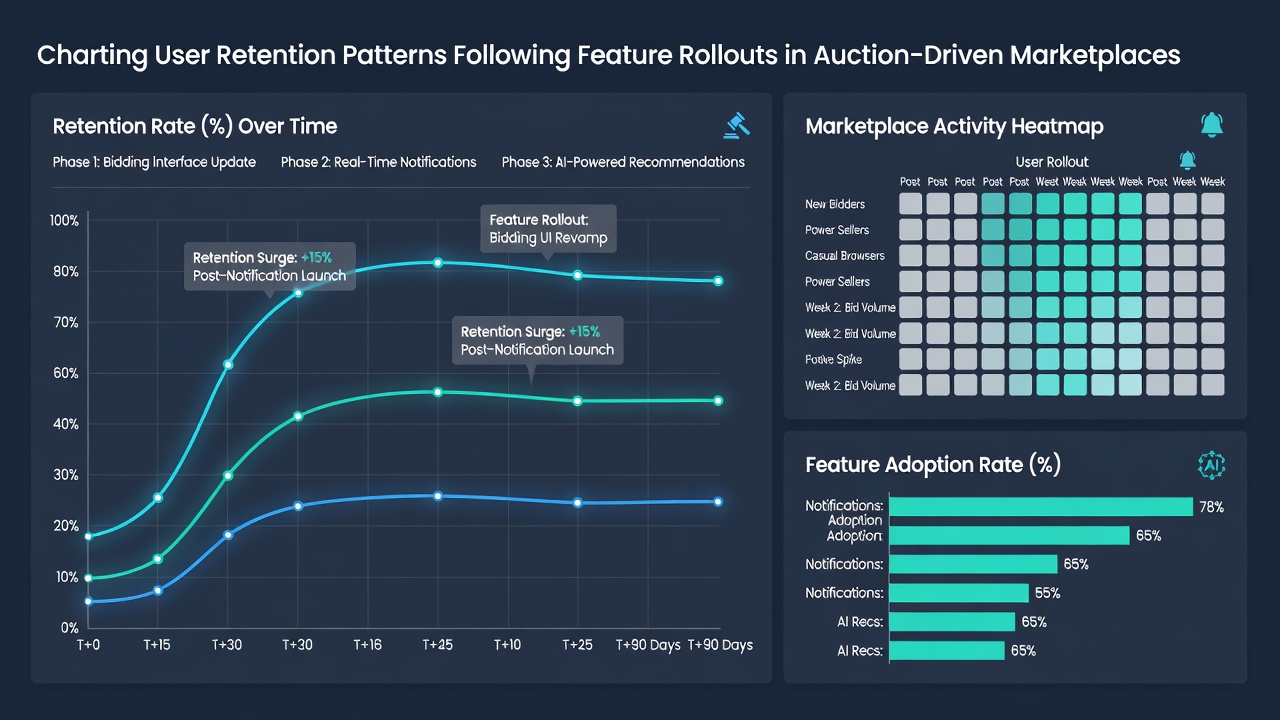
Short-term retention often climbs within 48 hours when a new search filter or mobile notification arrives, yet the lift fades unless the feature addresses a repeated friction point. Longer-term data shows that users who complete three or more transactions in the 30 days after launch remain active at rates 12 to 18 percent higher than pre-rollout cohorts. Platforms that delay full rollout until A/B testing confirms stability record fewer drops in the second and third months. One study released in late 2025 tracked 2.4 million accounts across three continents and found that incremental updates spaced six weeks apart produced steadier retention than single large releases.
Regional Differences Observed in 2025-2026
North American marketplaces displayed quicker adoption of real-time bidding dashboards, while European and Asia-Pacific sites saw stronger retention when features included localized currency and shipping options. Figures from the Australian Competition and Consumer Commission indicate that regulatory requirements for transparent fee displays correlated with a 9 percent improvement in seller retention during the same period. Platforms operating in multiple jurisdictions adjust rollout calendars to align with these regional reporting cycles, which in turn affects how global retention averages are calculated.
Measurement Challenges and Adjustments
External events such as payment processor outages or competitor promotions can mask the true impact of a feature, so analysts apply regression models that control for those variables. Privacy regulations limit the granularity of individual tracking, which forces reliance on anonymized aggregates. Teams therefore combine on-platform metrics with survey responses collected from random samples of active accounts to fill gaps. Data from October 2026 showed that users who opted into optional notifications retained at higher rates, yet the same group also generated more support tickets when the feature behaved unexpectedly.
Practical Applications of Retention Charts
Product teams use these charts to decide whether to expand, modify, or retire a feature before committing further engineering resources. Marketing departments time promotional campaigns to coincide with the retention upticks that follow successful rollouts. Finance groups incorporate projected retention improvements into revenue forecasts that extend 12 to 18 months forward. Observers note that marketplaces publishing transparent post-rollout reports attract more institutional sellers who value predictable platform stability.
Conclusion
Retention patterns following feature rollouts in auction-driven marketplaces follow repeatable shapes once sufficient longitudinal data exists. Consistent measurement practices, regional adjustments, and external benchmarks together produce charts that guide decisions across product, marketing, and finance functions. Continued collection of cohort-level metrics through 2027 will refine these models further, especially as new regulatory and technological variables enter the picture.